All the previous work
This page describes the steps of a business problem for a specified company, Waze.
We start by evaluating the problem in the context of PACE: Prepare, Analyze, Construct, and Execute.
This page describes the steps of a business problem for a specified company, Waze.
We start by evaluating the problem in the context of PACE: Prepare, Analyze, Construct, and Execute.
Waze’s free navigation app makes it easier for drivers around the world to get to where they want to go. Waze’s community of map editors, beta testers, translators, partners, and users helps make each drive better and safer. Waze partners with cities, transportation authorities, broadcasters, businesses, and first responders to help as many people as possible travel more efficiently and safely.
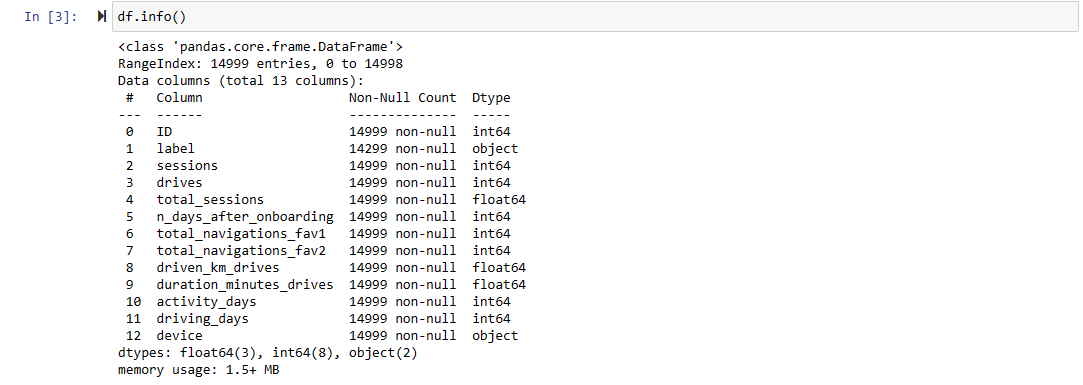
The dataset has consists of users' information in a particular month with 13 columns that include device type, distance in kilometers driven, and days of use.
We begin by installing our Python packages with necessary functions to be used in this analysis. This includes Pandas and Numpy for data manipulation and Seaborn for creating visual representations of our data.

Following the import of our CSV dataset into Jupyter notebook, we familiarize ourselves with the data by using Python's info() function, giving the data type of each column, in addition to the size of the file. We see that there are a total of 14,999 rows and 13 columns that comprise the dimensions of the dataset.

The next step is to view quantitative information about the columns in the dataset. We see the median, quartile, mean (or average), minimum and maximum values for each column in our dataset. We can start to make an educated guess about the existence of outliers in the data and delve further into the structuring phase of EDA, which includes creating new calculated columns out of existing columns to get insights about typical users of the Waze app.
